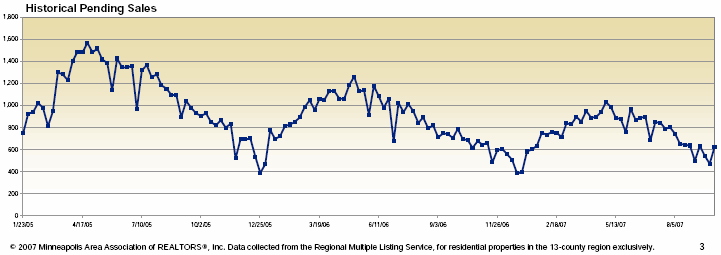
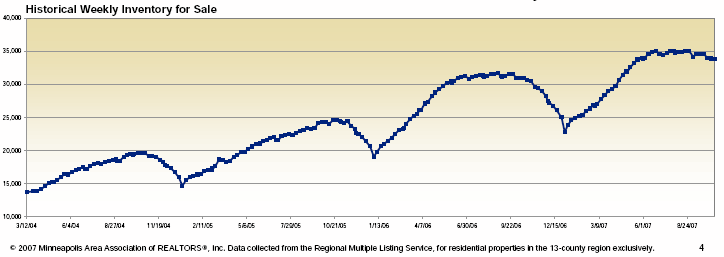
Take a look at the two charts below:


These graphs are on different time scales (3 years and 4 years respectively) but the trends are extremely easy to read: Sales volume has fallen substantially from its highs in 2005 and inventory this year has climbed to record highs.
While the growth of inventory has fallen sharply, up just 9% from a year before, inventory is still higher than last year, which means we’re still in a toughening market. This is NOT a housing market crash, but it is a market correction that has not yet run its course.


