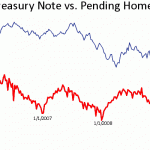
A reader of this blog asked a good question this weekend: what happens to sales when rates rise? This is an intriguing question. While I had my suspicions, I wasn't sure what I would find so I put together this little image from Twin Cities MN Pending Sales and the 10 Year Treasury Note. While the 10yr isn't a direct mortgage interest rate gauge, it correlates very closely. This chart is on a 5 year scale. (Pending home sales data from MAAR, click image to see larger picture) What we see from this chart … [Read more...]


