Twin Cities Home Sales Climb 10% !!!!

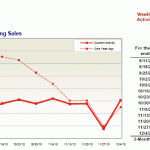
After six months of lower year-over-year pending sales numbers, the Twin Cities has finally posted an improvement in sales activity.  The week ending 12/4/10 saw 606 pending home sales versus 551 in the same period a year ago, which is an increase of 10% from the prior year’s figure.  Pending sales are properties that have accepted offers but have not yet closed.

You’ll notice that each week there’s been an improvement in year-over-year comparisons and that is partly due to the artificial demand we saw last year when the tax credit was originally set to expire.  This week’s sales increase is pretty good news in and of itself but what is even more interesting to me is that sales for the week ending 12/4 in 2010 looks to have been the strongest showing for that week since 2006!  While it isn’t a huge jump in sales in comparison to prior years, it is still a small improvement.  What is striking is how consistent the sales have been since the expiration of the tax credit:

Weekly Pending Sales

While the numbers are not huge, they have been consistent and that is reassuring – no matter the circumstances, a certain number of homes will be bought and sold and this leveling in demand says to me that we’ve found that fundamental level.  An early review I did of pending sales for the week ending 12/11/10 shows sales just about where they were the same week last year, which would make it the 2nd best week in comparison to the prior year since the tax credit expiration.

The housing market is far from recovered but at least it’s reassuring to see an occasional positive indicator like we did this week.

Twin Cities Real Estate May Market Update

Here is the most recent housing market update video:

Q4 Lender Mediated Report & City Level Data Released

Today I am pleased to announce the release of the Foreclosures and Short Sales in the Twin Cities Housing Market: Q4 2008 Update.  This is the 4th installment of quarterly reporting of lender mediated sales and their impact in the Greater Minneapolis/St. Paul area, which I co-author with the musically, intellectually, politically and statistically talented Jeff Allen.  2008 reports from quarters 1, 2 and 3 are also available.

Here’s how to know if buying a foreclosure or short sale is right for you.

This quarter’s report continues to show the same trends we’ve seen all of 2008, mainly an increase in the market share of lender mediated MLS listings both for sale and those that sold in the quarter.  Traditional sellers are very seasonal and so while the fact that 46% of sales and 42% of new listings in Q4 were lender mediated is very notable, it is somewhat inflated by the seasonality.

While some trends have certainly continued from previous quarters, we have seen a new trend develop as well: the Q2-Q3-Q4 period showed a relative peak of new lender mediated listings coming on, and Q4 showed our first drop in both lender mediated new listings inventory for sale at quarter-end.  Prior to Q2 2008 we saw dramatically more new lender mediated listings each quarter since 2006, while the Q2-Q4 period demonstrated a stop to that growth, at least for now.  There’s no way to know whether this near-term peak will turn out to be the long-term peak of this market activity or simply a stepping block to higher volume in 2009 but the fact that this trend is solid for 3 straight quarters is certainly an optimistic indicator.Q4 Lender Mediated Report - New Listings

Hennepin County, who publishes their sheriff sales online for a rolling 12 month period, reported 550-700 sheriff sales each month for all 2008, with a significant trend down since July 2008.  November and December’s relatively low number of foreclosures may be at least partly attributable to Fannie Mae and Freddie Mac’s decision not to take foreclosure actions from Thanksgiving through the end of January (it was extended).  While Hennepin County is only one of 13 counties in the RMLS’s definition of the Twin Cities, it is by far the largest in terms of foreclosures and is a good (but not complete) indicator of what is going on in our market on the foreclosure side of things.  Keep in mind that the Lender Mediated report that Jeff Allen I produce includes foreclosures AND short sales while this data is only sheriff sales, which is a middle-step in the foreclosure process.  Most homes take 6-8 months after the sheriff sale to get listing on the MLS.
Hennepin County Sheriff Sales through December 2008

But Wait!  There’s Much More!

I’m glad you kept reading… this is where it gets really good.  For the first time in the Twin Cities, and I believe the first time anywhere in the country, we are able to release city/area level lender mediated sales information.  While the metro-wide reports are very helpful, they do not adequately explain what is happening in individual communities throughout the area.  Some communities are barely impacted by these listings, while other communities find that well over 50% of their recent sales and current inventory for sale lies in foreclosures and short sales.  It also demonstrates using actual market sales information that the higher the proportion of lender mediated sales you have in an area, the more “pain” the traditional sellers in that community suffer as well, in terms of more significant year-over-year median sales price decreases.

As every expert in this field has said, this housing market is very localized and these new reports help give a better glimpse into how true that statement really is.  While this information is very helpful, it can sometimes be misleading as well.  We are working with smaller sample sizes when we get down to the local level and in many communities there simply was not enough data to accurately report what is happening, so we didn’t publish data in those communities.  In the communities we did publish, there is the occasional “huh?” moment where the data reported simply doesn’t match up with the daily experiences in the market.  This could be because of the low sample size, which allows individual listings to have a major impact on the results, or it could be because what is selling today is different than before… i.e. some communities have very few Traditional Seller townhouses and condos selling but many single family houses selling so the Median Sales Price actually is higher this year over last year.  It isn’t that prices increased, but that the “typical” house selling this year is at a higher price point.  Unfortunately there wasn’t a reasonable way for us to take those kind of events into account and so we leave that interpretation to you.  Take a look at price per square foot as another good indicator of value changes… while this too can be skewed in some cases, it seems to be reporting numbers that FEEL more accurate to me in terms of change year over year than the Median Sales Price sometimes suggests.

Aaron Dickinson and MAAR Publish Report on Foreclosures and Short Sales on Twin Cities MLS

You can find the report here.

Background

In late October I wrote a blog post regarding foreclosures and short sales listed on the MLS in the Twin Cities. Once I started researching this topic, I found that the information I was uncovering was previously unknown in our market and that the trends it offered were very insightful. I shared this first-step research with Jeff Allen from MAAR and we decided to work together to explore it further.

The hardest part of this whole research project was developing the methodology & technique used to compile the appropriate data. Our local MLS does not have specific flags for foreclosures or short sales, so agents place myriad varieties of disclosures in the Agent, Public and Financial remarks. What’s worse, there’s no way to query all 3 fields at the same time so all the sold data had to be exported to an Access Database and queries run against that. We also had to come up with the appropriate terms. I provided Jeff a list of keywords I’ve seen used, which were then cross-checked to determine if they were reliable list of phrases. Because phrases like: “subject to bank approval” could mean a short sale or a bank owned property, we were unable to split up the data into “short sale” and “bank owned” categories.

After we had extracted the relevant properties, the next task was analyzing the data to determine what trends were evident and how they could be useful to the REALTOR membership as well as the public at large. Once we compiled these reports, we then had to submit our findings and report proposal to the MAAR Board of Directors for approval. Once we received that approval, we spent the last few weeks putting final polish on the report.

As mentioned before, here is the report. Tip of the hat to Jeff Allen @ MAAR for the excellent write-up of the analysis and to the MAAR Marketing Department for polishing up the report into something visually attractive.

Equal Housing Opportunity and REALTOR logo

TwinCitiesRealEstateBlog.com is not a Multiple Listing Service MLS, nor does it offer MLS access.
This website is a service of Aaron Dickinson of Edina Realty, a broker Participant of the Regional Multiple Listing Service of Minnesota, Inc.