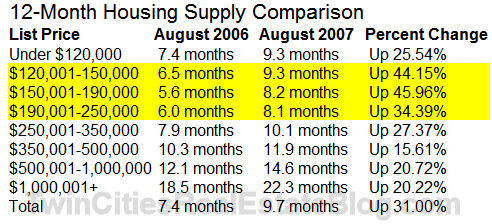
MAAR just released some statistics for August 2007. Below you will find a chart showing a comparison of housing supply between August 2006 and August 2007. While the higher price points have the most months’ supply, the lower price points have seen the highest percentage increase in months’ supply over the last year.
What does this mean? Our market is slow because the 1st time buyer activity is slow. With all the changes in the mortgage market and the higher interest rates over summer, the 1st time buyer is being sidelined in this market. Until we have real strength come back into this segment, we’re going to continue to see weakness throughout the housing market.