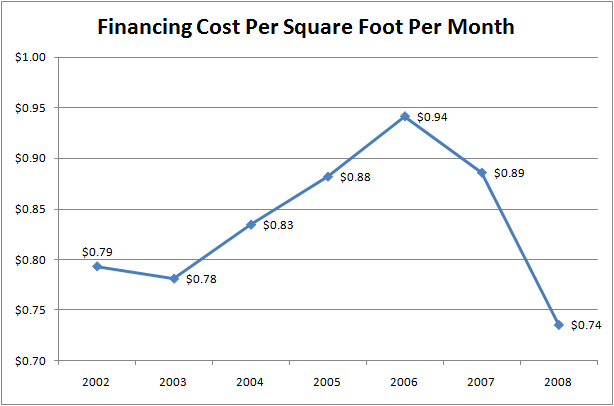
I love data… be it hard numbers, graphs, charts, tables, interpretation, etc. I’ve come up with another concept of tracking overall affordability: combining cost per finished square foot with mortgage rates to give an overall cost of financing each square foot of house over the last few years (I only had data back to 2002):

This chart is using approximate mortgage costs and an estimated cost per square foot for 2008 so this isn’t “scientific quality” but the trend is very clear and I think it’s close. What’s stark about this picture is that while most of us would agree that 2005 was the “peak” of the market, median sales price actually rose $1,100 in 2006 over 2005 and mortgage rates ticked up as well. This lead to 2006 being the peak of homeownership un-affordability. With the dramatic drop in house prices as well as interest rates in the 2nd half of 2008 we’ve seen financing costs for homes drop accordingly to levels not seen in many years. This cost excludes taxes, insurance, utilities, maintenance costs and mortgage insurance, if any.
I think this is another good indicator of the improvement in affordability and shows that we’re getting back closer to more normal historic levels of affordability. What do you think about it?


