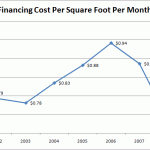
I love data... be it hard numbers, graphs, charts, tables, interpretation, etc. I've come up with another concept of tracking overall affordability: combining cost per finished square foot with mortgage rates to give an overall cost of financing each square foot of house over the last few years (I only had data back to 2002): This chart is using approximate mortgage costs and an estimated cost per square foot for 2008 so this isn't "scientific quality" but the trend is very clear and I think it's close. … [Read more...]


